Prove what your AI agents did.
Which agents run, who owns them, what they called and what they cost. On the same platform that watches the servers they run on.
Unknown is never zero.
The four questions every audit asks
REGISTER
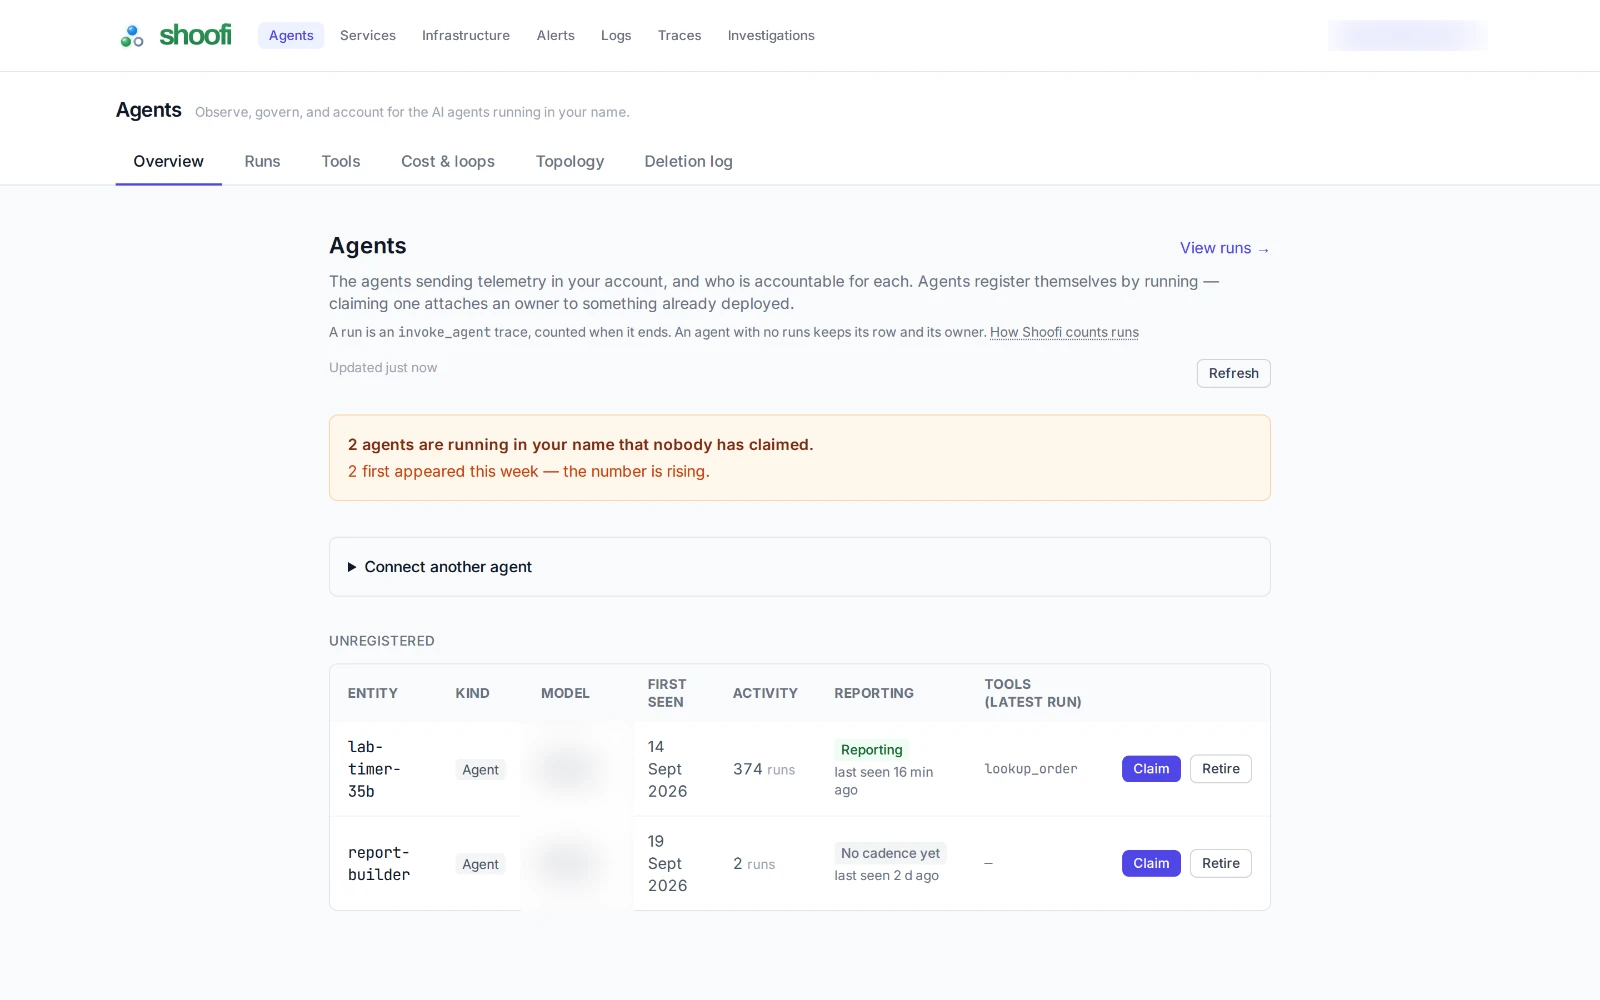
Every agent has an owner.
Claim each agent with an owner, a purpose, a risk level and an environment. Agents running in your name that nobody has claimed are listed on their own, so shadow AI shows up instead of hiding.
RUNS
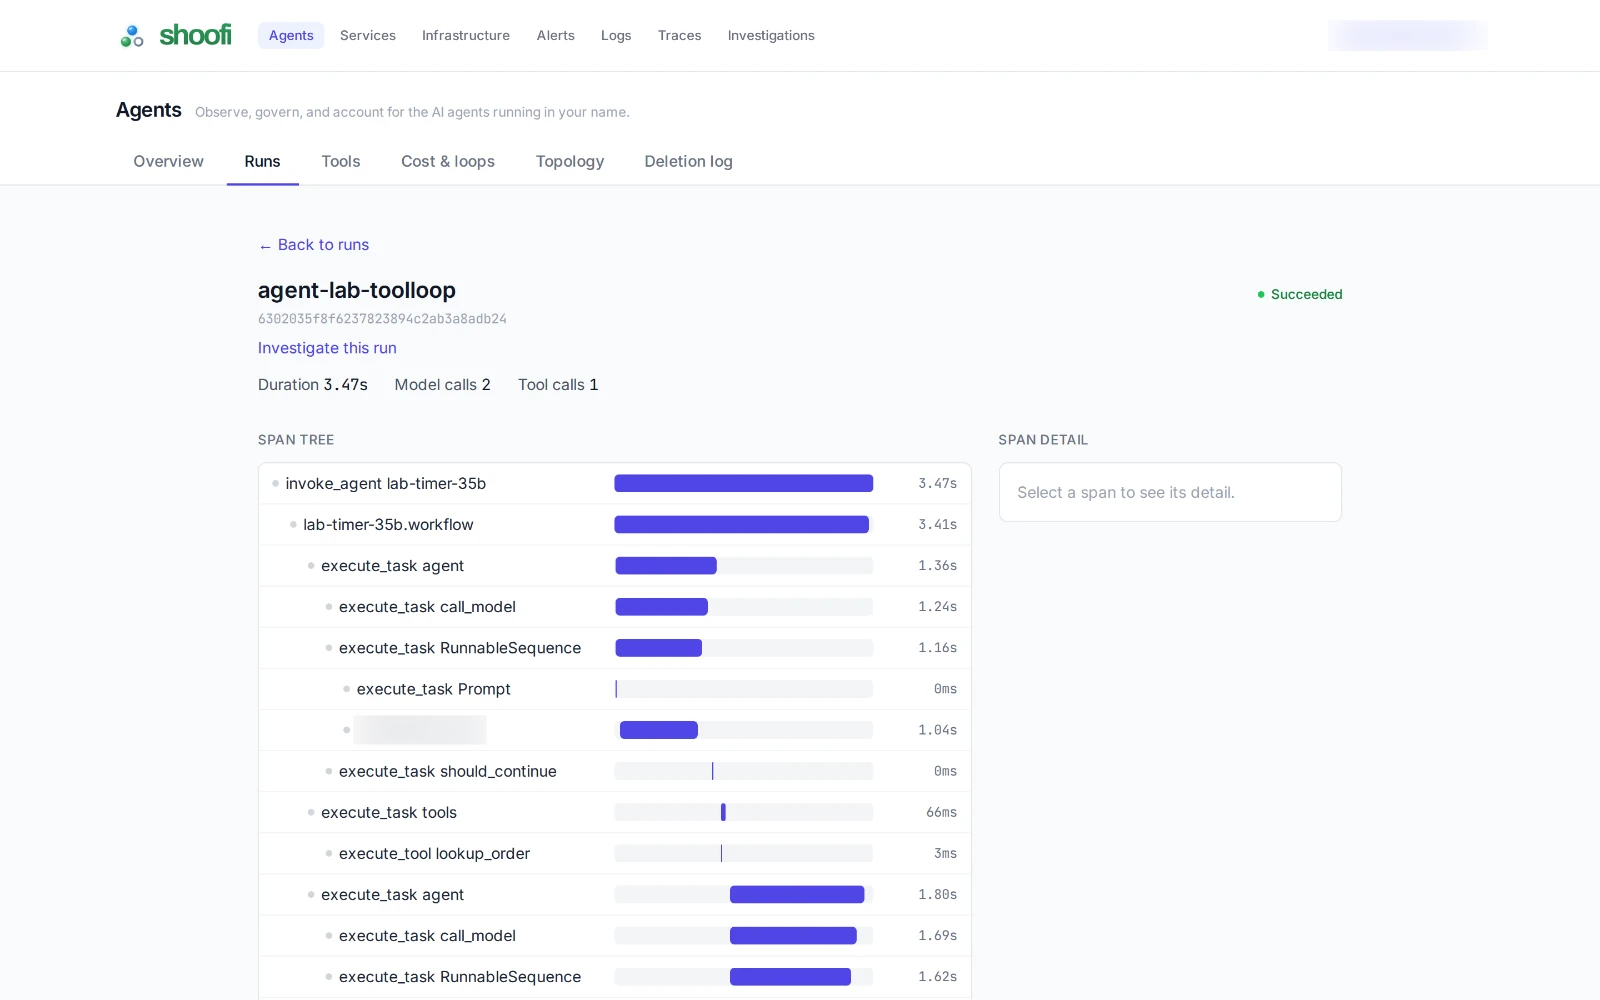
Every run, on the record.
Spans, model calls, tool calls and cost for each run. Runs are kept as their own records, so they outlive the traces they came from.
EVIDENCE
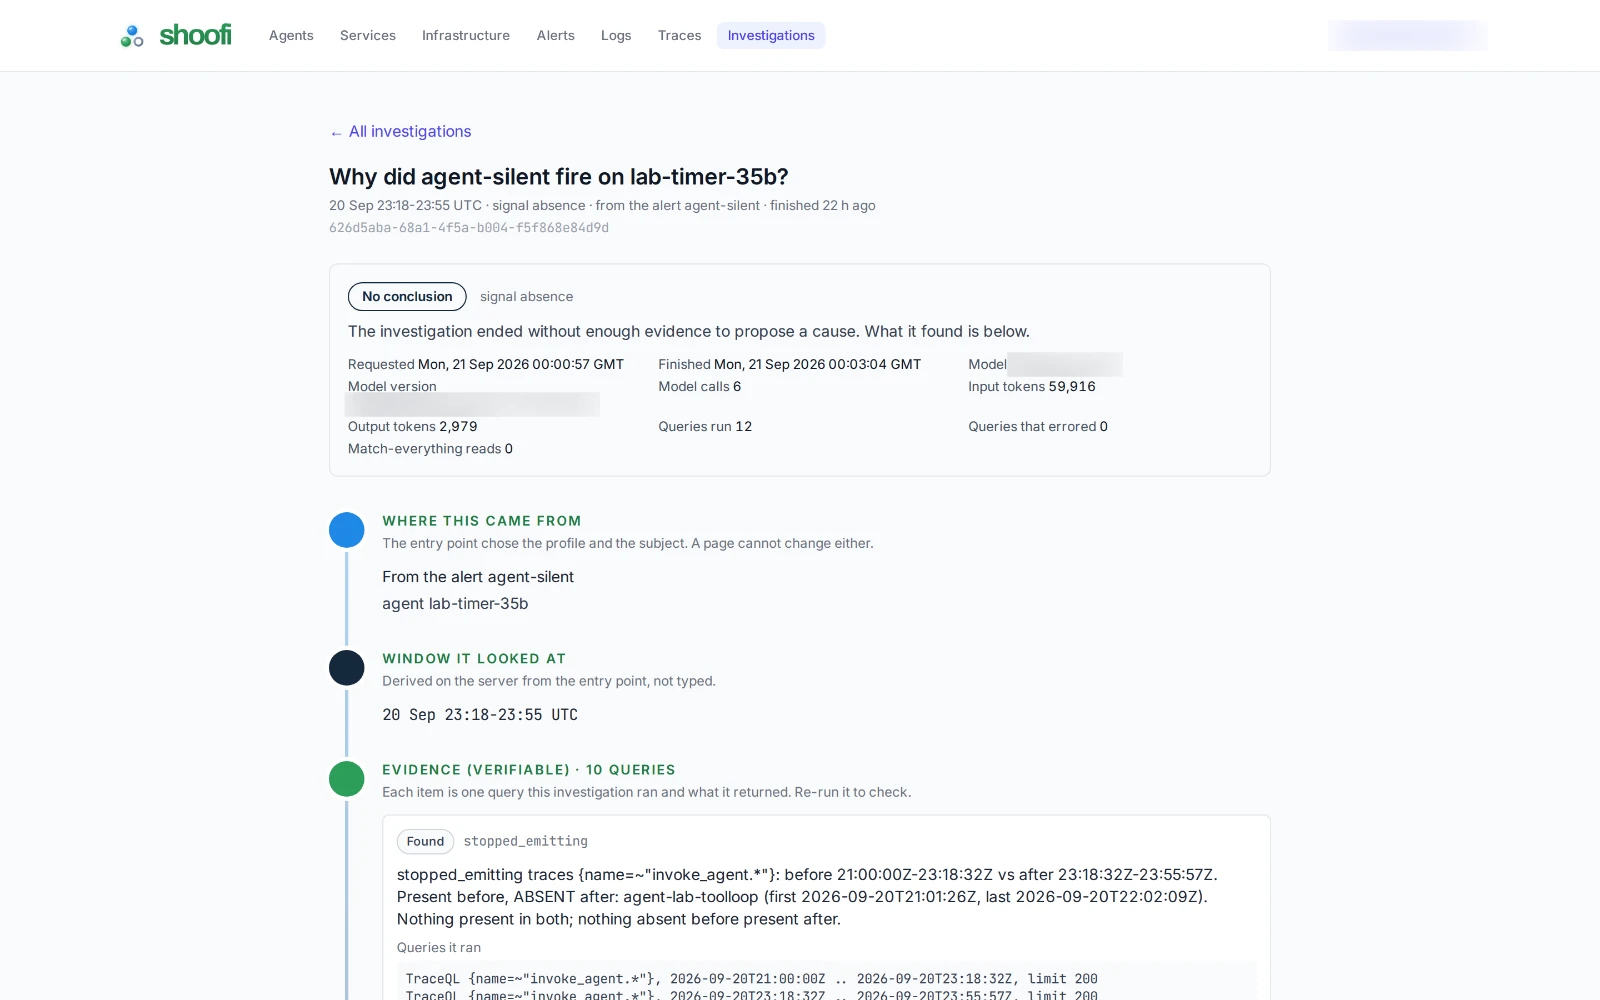
Every finding shows its query.
When investigations are switched on for your workspace, they gather evidence from your metrics, logs and traces. Each item shows the query it ran. Re-run it, and shoofi tells you whether it still matches the evidence or the data has changed since.
ALERTING
Judged against its own rhythm.
shoofi learns how often each agent reports and alerts when it goes quiet for far longer than usual. A nightly job and a five-minute job are held to different bars. When shoofi cannot see your agents at all, that is its own alert, never a green light.
FOUNDATION
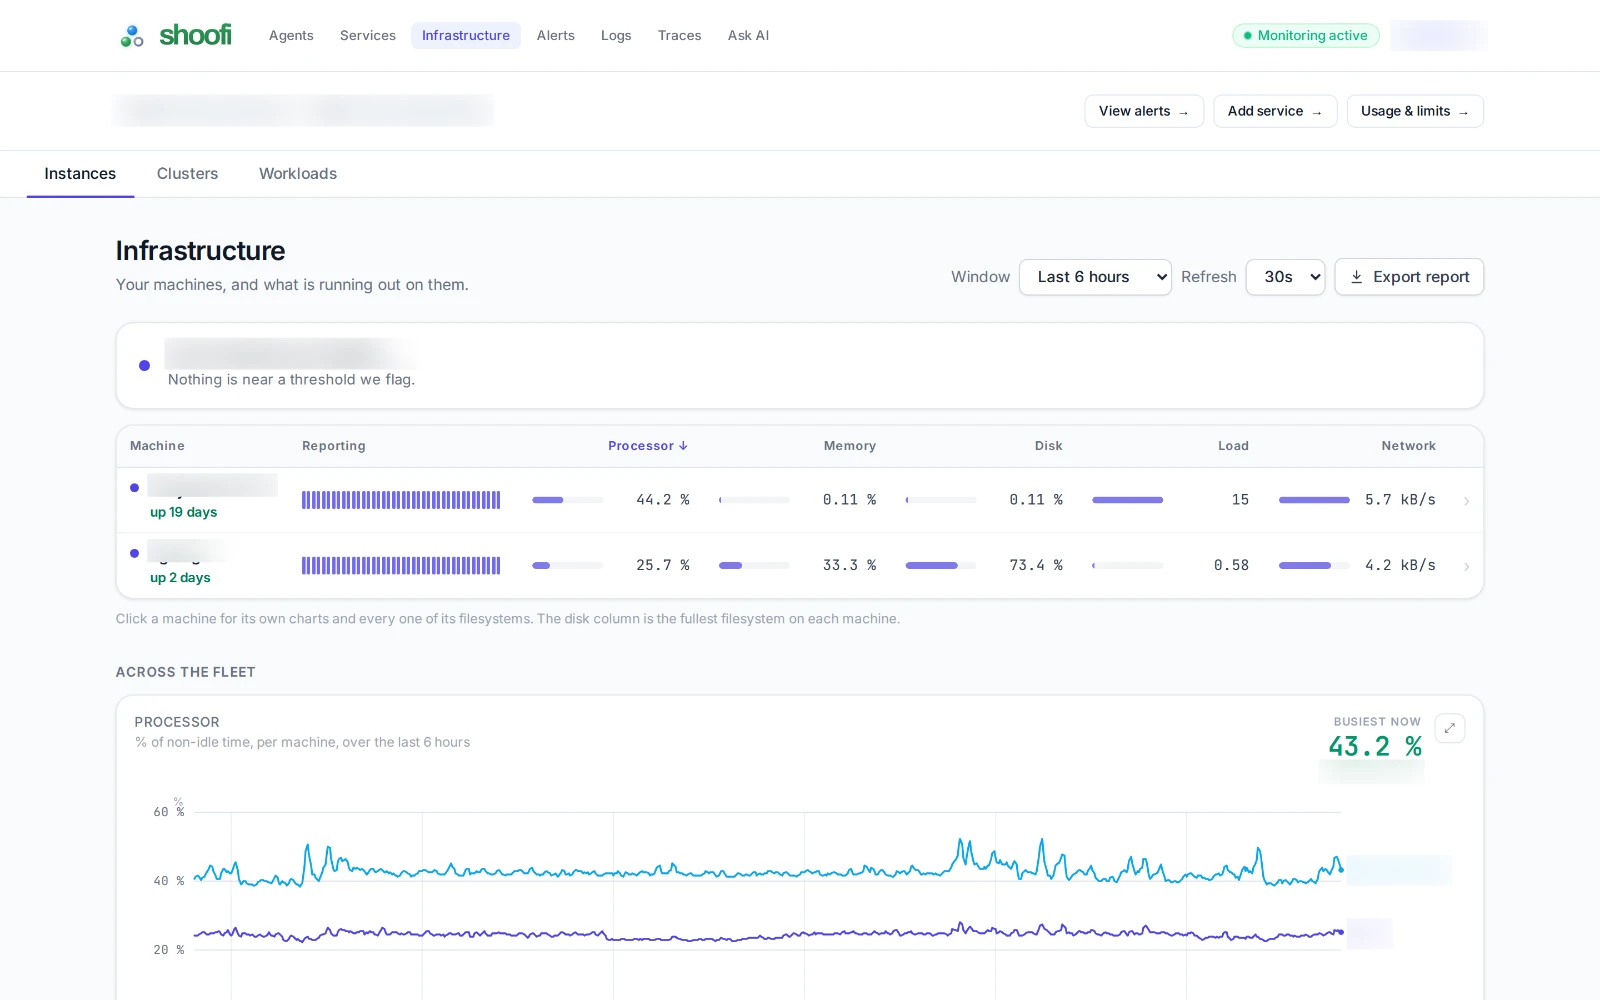
And it watches everything underneath.
Hosts, containers, Kubernetes workloads, logs, traces, URL uptime and TLS certificates, with a maintained catalogue of alert rules you switch on and tune. Alerts arrive by email or Telegram.
- 1Pick what to watch.
- 2Copy the collector config we generate for you.
- 3See the first data arrive.
HONESTY
The list most vendors leave out
- It proposes hypotheses for you to check. An investigation can end with "No conclusion", and it says so.
- It never turns an unmeasured value into zero.
- When it cannot see, it tells you, instead of reporting healthy.
- It records and proves. It does not block agent actions.
- It gives no confidence scores.
INTEGRATIONS
What shoofi connects to
MODULE
AI agents
What shoofi is built for, on the same platform that watches the machines your agents run on.
Every agent run recorded with its tools, cost and outcome, plus an inventory of agents nobody has registered yet.
Included in Pro and Enterprise. An option on Starter.
Included in every plan
- Linux hosts
- CPU, memory, disk and network for every server or virtual machine.
- Logs
- Collected, searchable and tied to the host that produced them.
- Traces
- OpenTelemetry traces from your applications.
- Alerts
- Telegram, Slack and email.
Plugins
Starter includes 2 of your choice. Pro includes all of them.
- Docker
- CPU, memory, network and disk per container.
- Kubernetes
- Cluster, nodes and workload health.
- Uptime & TLS
- Checks from outside that your endpoints answer over HTTP and HTTPS, and alerts before a certificate expires.
- PostgreSQL
- Connections, queries, replication and storage.
- MySQL
- Connections, queries, replication and storage.
- OpenSearch
- Cluster health, indexing and search latency.
More coming soon.
Running something else? Tell us.
Off means off.
Every AI feature is switched on or off per workspace. When it is off, its routes do not exist for you, so there is no path to the model. And an investigation reads only your own workspace’s data.
PRICING
Three ways to run it
Prices in US dollars (USD), excluding VAT. The billing currency is agreed in the contract.
Infrastructure monitoring
- 5 supervised nodes
- 10 GB of logs a month
- 2 plugins of your choice
Infrastructure and AI agents
- 20 supervised nodes
- 50 GB of logs a month
- AI agent observability, 10 agents
Deployed in your own infrastructure, including with no internet access
- Limits per contract
- Evidence chain verifiable offline
- Investigations with your own LLM
Questions we get
- What do I install?
- An open-source collector on your side. We generate its config with your token. AI agents send their traces over OTLP/HTTP.
- Which agent frameworks work today?
- Proven end to end: LangGraph instrumented with Traceloop, over OTLP/HTTP. We validate other frameworks with each design partner.
- How do I get access?
- Accounts are created with an invite code. Book a call and we set you up.
Book a call
We onboard each design partner ourselves, on a call.